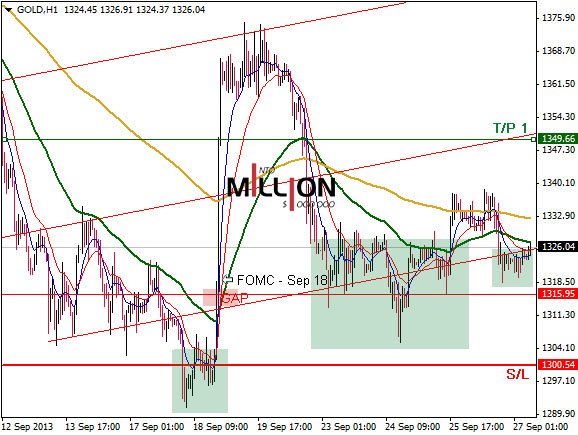
Hourly Chart
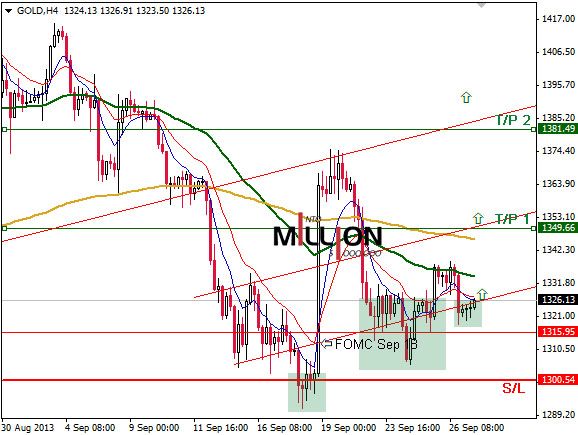
4 Hourly Chart
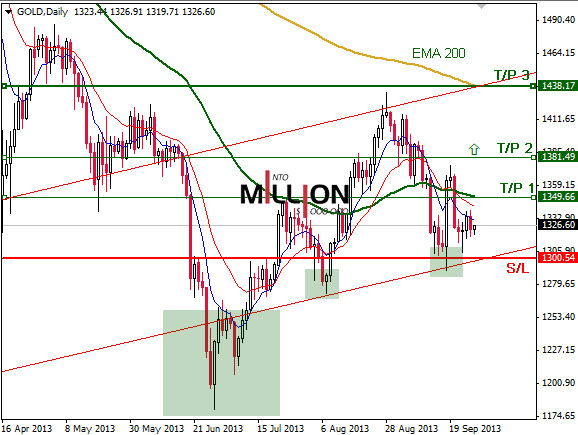
Daily Chart
Preference:
4 Hourly Chart
Daily Chart
Preference:
Daily Chart
Preference:
Preference:
Long positions above 1300 with targets 1350, 1380, 1440
Bought at 1322 S/L 1295 (2700 pips),
T/P-1 1350 (2800 pips), Risk 1:1
T/P-2 1380 (5800), Risk 1:2
T/P-3 1440 (11800 pips), Risk 1:5
Period of Time:
1 – 3 Months
Basis:
- Double Bottom, Reversal Head-and-Soulders on H1 Chart
- Repeated breakouts of low period Moving Avareges on H1 – H4 Chart
- Double Bottom on D1
- Aggressive monetary policies of Major Central Banks (FED, BOJ)
- Over 1 Trillion of “printed” Dollars due to QE programm in U.S.
- Market reaction on FOMC Statment form Sep 18. No Taper, Fed to continue QE at $85 billion/month
- Policy of low interest rates